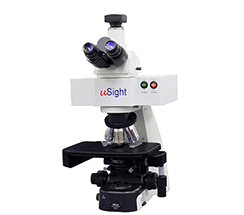
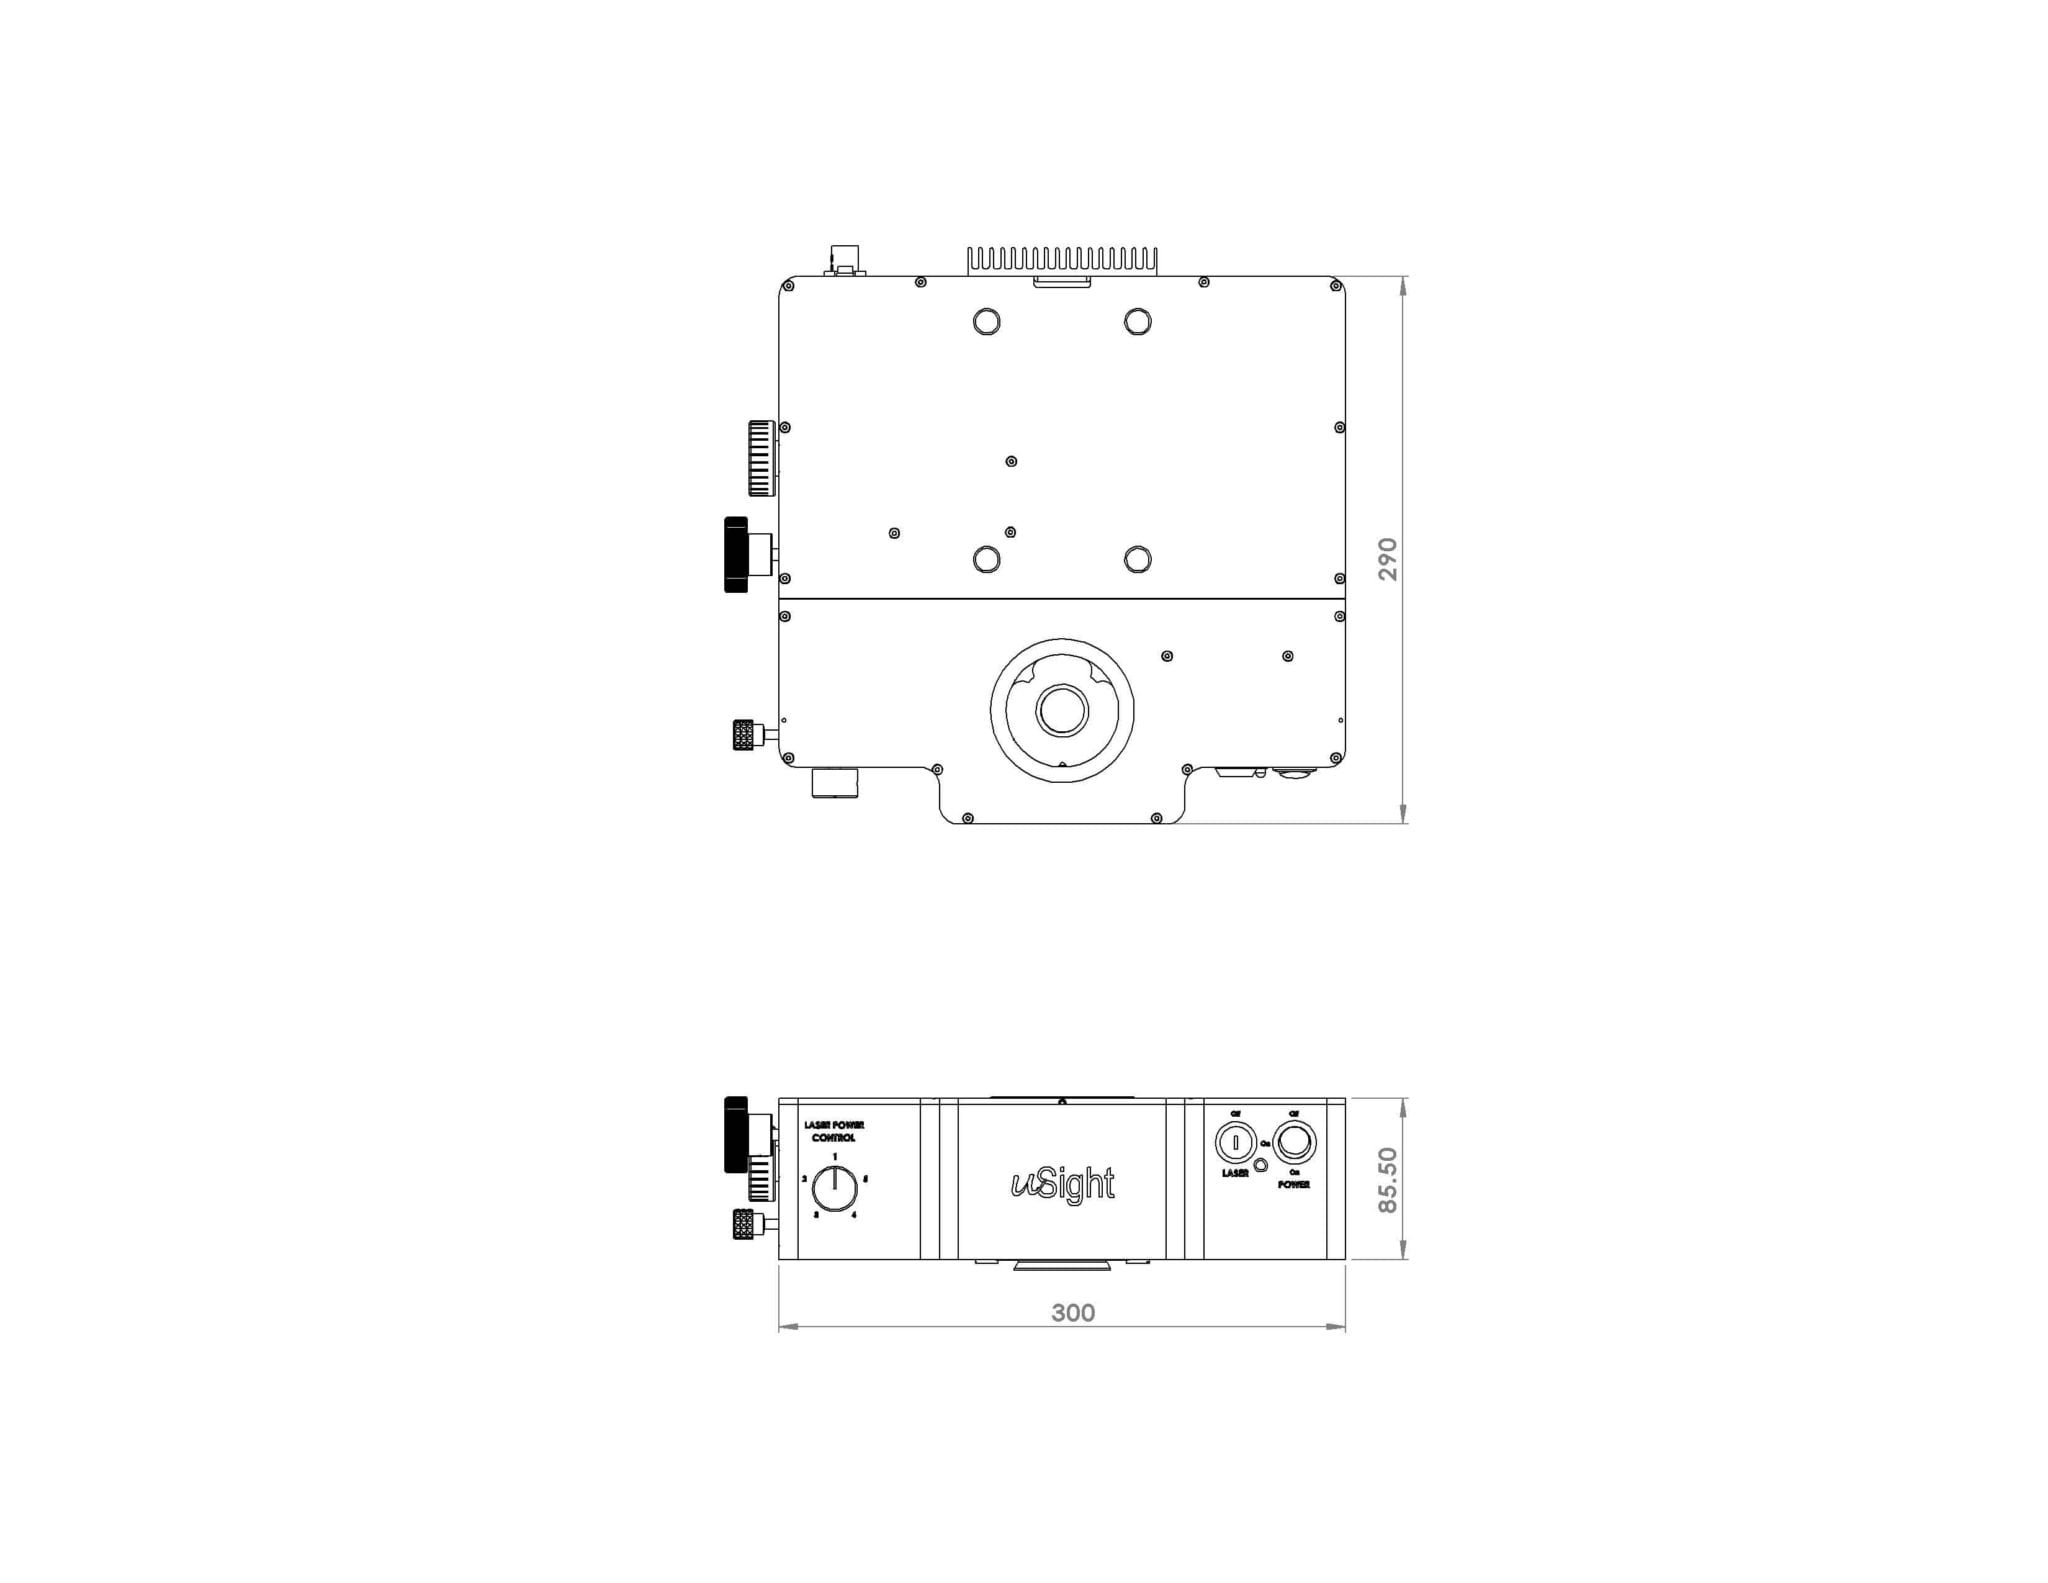

The uSight-X is a compact Micro-Spectroscopy module that offers users the flexibility to connect, via optical fibre cable, different types of detectors ranging from compact spectrometer to high-end research grade spectrograph.The module is ideal for laboratories that requires the flexibility to utilize existing or varying combination of spectrometers or spectrographs for varying samples and can be configured to cover measurement such as Raman, Photoluminescence and Fluorescence.
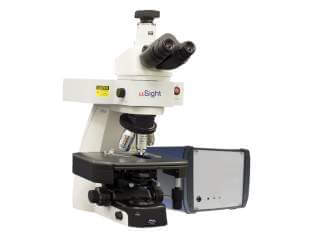
Dual or even triple modules with different excitation wavelength can also be stacked and used with existing microscopy techniques such as DIC, Fluorescence, Dark-field, polarization, etc, imaging.
• Compact and affordable
• Small Measurement Spot <1.0 um
• User controllable laser power
• Mapping Options available
• Polarization add on options
• Suitable for Raman, Photoluminescence and Fluorescence
• Available in 532nm, 633nm, 785nm. 830nm
Flexible micro-spectroscopy solution ideal for your vast research applications
| uSight-X Micro-Spectrometer | |||
| Laser | 532 nm | 633 nm | 785 nm |
| Laser Type | Single Mode Frequency-Stabilized | ||
| Laser Power | 70 mW | 70 mW | 100 mW |
| Laser FWHM Bandwidth | ~100 MHz | ~150 MHz | ~105 MHz |
| I/O Control | Shutter ON/OFF and modulation | ||
| Power Supply | 5 Vdc | ||
| Dimensions | Length x Breadth x Height 30 x 29 x 8.5 (cm) | ||
Introduction to Raman Spectroscopy
Raman scattering is the inelastic scattering of light and is a result of molecular vibrations. The light interacts with the molecule and distorts the electronic cloud around the nuclei. This distortion results in polarization of the molecule and forms a short-lived state known as ‘virtual state’. The photon is re-radiated as this state is unstable. Raman spectroscopy involves the measurement of the energies of these re-radiated photons. It is a vibrational spectroscopy technique that can provide a spectral ‘fingerprint’ of the sample under investigation.
The energy changes detected in vibrational spectroscopy are those that cause nuclear motion. Photons are scattered with very small energy changes if only the electronic cloud distortion is involved. This is the cause of Rayleigh scattering which is the elastic scattering of light and is the dominant process. However, if a nuclear motion is involved, there is either an energy transfer from incident photon to the molecule or from the molecule to the scattered photon. Hence the scattered photon may have lower or higher energy than the incident photon. The former process is termed as Stokes Raman scattering and the latter as anti-Stokes Raman scattering (Figure 1). The molecule should be in a higher energy state to generate anti-Stokes Raman photon and it may be caused by thermal excitation, governed by Boltzmann distribution. The anti-Stokes Raman scattering is substantially weaker than the Stokes Raman scattering but has the advantage that it is less affected by the luminescence background.
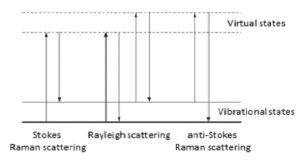
Figure 1: Energy diagram showing the Rayleigh and Raman scattering processes
Instrumentation
In a commercial Raman spectroscopy instrument, monochromatic laser light is directed onto the sample using optical elements and the scattered light collected and focused either on a collection fiber bundle (Figure 2) or on the slit of a spectrometer. A band pass filter is used to ‘clean’ incident laser light while a notch or an edge filter is used to block the dominant scattered laser light. The collected light is then dispersed in the spectrometer using a diffractive optical element and detected on a charged coupled device (CCD).
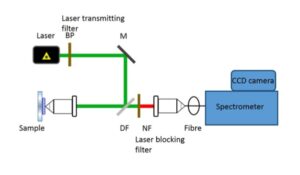
Figure 2: Schematic of a confocal Raman instrument
The choice of laser wavelength is very important in biomedical Raman spectroscopy applications. The reduced scattering coefficient generally decreases as we move from visible to near infrared (NIR) wavelengths. Light of visible wavelengths is also absorbed by tissue constituents. This results in lower penetration depth in tissue of the excitation light and also the generation of high fluorescence background in the acquired Raman spectra, affecting the quality of Raman signal. NIR light is weakly absorbed by tissue. Hence NIR laser wavelengths (for example 785 nm or 830 nm) for Raman excitation have the advantage of higher penetration depth and comparatively lower fluorescence background generation. Nevertheless, one should note that after 1064 nm, the absorption of light by water increases rapidly and this can again decrease the penetration depth of light in biological samples.
The fluorescence background in Raman spectra can be minimized using clever instrumentation, such as the use of hollow core optical fibers or photonic crystal fibers [1]. Also, by separating the excitation and collection arms of the Raman instrument it is possible to collect light from a localized region of interest [2], minimizing the luminescence background and increasing the Raman signal to noise ratio. Shifted Excitation Raman Difference Spectroscopy (SERDS), where Raman excitation is performed using lasers with slightly varying wavelengths, can provide elimination of fluorescence background for simple compounds. But, biological tissue consists of numerous fluorophores and such techniques are not useful for fluorescence background rejection. It is a common practice in the field of Raman spectroscopy to fit a polynomial to the Raman spectrum and subtract it in order to get rid of the fluorescence background. This method can help in a better qualitative visualization of the Raman peaks but does not help in quantitative prediction of bioanalytes. There is always a risk of introducing spurious background. Fluorescence background contains important information about the sample under investigation
References
[1] Khay M. Tan*, Gajendra P. Singh*, Simon Herrington, Tom Brown. Near-infrared Raman spectroscopy using hollow-core photonic bandgap fibers, Optics Communications, Volume 283 Issue 16 pages 3204-3206 Year 2010
[2] Ishan Barman , Khay M. Tan, Gajendra P. Singh. Optical sectioning using single-plane-illumination Raman imaging, Journal of Raman Spectroscopy, Volume 41 Issue 10 pages 1099-1101 Year 2010
Confocal Raman Imaging/ Optical Sectioning
Optically sectioned Raman images can be obtained from a sample of interest by either using a confocal back-scattering or off-axis geometry. In the confocal Raman spectroscopy/imaging system, a pin-hole is utilized to spatially filter away light emanating from outside the desired excitation volume (Fig.1), while in an off-axis Raman system (Fig.2), the excitation and collection arms are inclined at an angle. In the off-axis system, excitation of Raman light can be achieved using a now numerical aperture (NA) optics, and it prevents sample damage by excessively focused light, while the collection of Raman light can be achieved using high NA optics. Thus the spurious contributions by portions of a sample that are outside the region of interest can be avoided. Another important advantage of the off-axis system is the excitation of low background from the system optics.
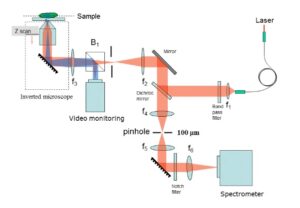
Fig.1: Schematic of a confocal Raman imaging/spectroscopy set-up
To obtain 3D images in a confocal Raman system, the sample is positioned in a plane perpendicular to the direction of excitation using the translational stages. Thus Raman spectra is acquired point by point and finally information is stitched together to obtain Raman image from desired region of interest. For biological tissues, where the Raman cross section is low, this step can be time consuming.
Wide field Raman imaging is employed to obtain Raman images of larger regions of interest in shorter time. The slit of the spectrometer can be used as a spatial filter, thus avoiding the use of small pin-holes and increasing throughput. But, spectral resolution may be compromised and hence a balance of aperture size to the Raman signal desired is required.
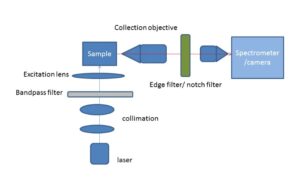
Fig.2: Schematic of an off-axis excitation Raman imaging/spectroscopy set-up
These two imaging methods can be used to effectively perform optical sectioning and extract information from a small sampling volume from within various heterogenous layers. Further, through planar and depth scanning of each small sampling volume, a 3D image of the sample under investigation can be developed.
The lateral and axial resolutions can be qualitatively defined according to the following equations:
Lateral resolution ~ (2*l)/(π*NA) (1)
Axial resolution ~ (n*l)/(NA2) (2)
where lis the wavelength of the light in air, n is the refractive index, and NA is the numerical aperture of the excitation/collection optics respectively.